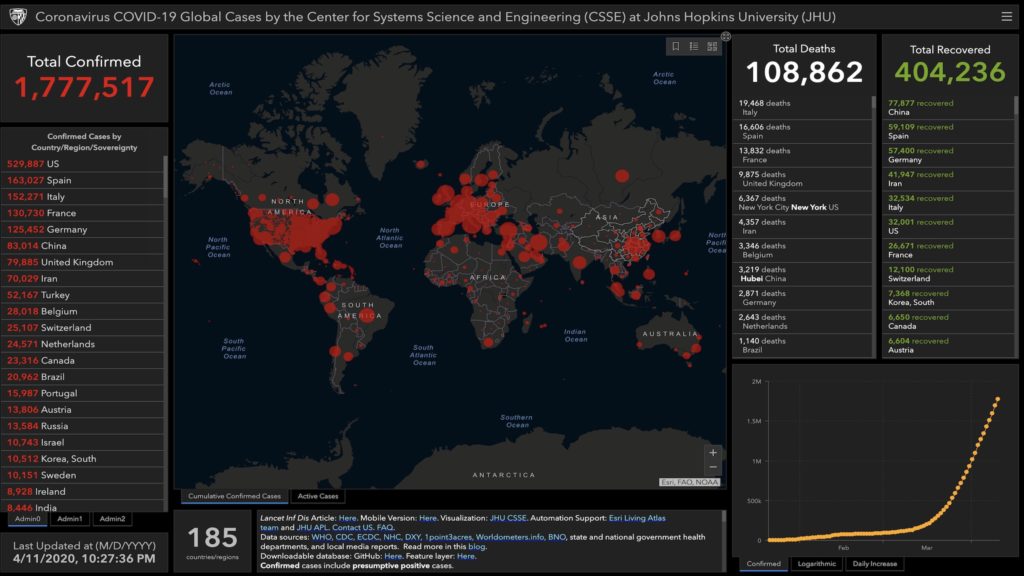
 This tracker from Johns Hopkins University provides realtime information and counts cases of COVID-19 coronavirus in China, as well as around the world, including numbers of deaths, recovered patients, and countries affected.
The World Health Organization has its own coronavirus dashboard as well, but includes only its own information, whereas the Hopkins team synthesizes data from WHO and four additional sources: CDC, European Centre for Disease Prevention and Control, China’s National Health Commission, and ncov.dxy.cn, an independent data source maintained by Chinese physicians.
Lauren Gardner, associate professor of civil and systems engineering and co-director of the Center for Systems Science and Engineering (CSSE), led the dashboard development effort. There’s also a mobile version as well as full size.
The dashboard reports cases at the province level in China, city level in the US, Australia and Canada, and at the country level otherwise.
Who started the dashboard?
Professor Lauren Gardner, a civil and systems engineering professor at Johns Hopkins University, built the dashboard with her graduate student, Ensheng Dong. It is maintained at the Center for Systems Science and Engineering at the Whiting School of Engineering, with technical support from ESRI and the Johns Hopkins University Applied Physics Laboratory. Gardner is co-director of the CSSE. Learn more about Gardner and the CSSE by visiting its website.
When and why was this map started?
The map was first shared publicly on Jan. 22. It was developed to provide researchers, public health authorities, and the general public with a user-friendly tool to track the outbreak as it unfolds. All data collected and displayed are made freely available through a GitHub repository, along with the feature layers of the dashboard, which are now included in the ESRI Living Atlas. For a detailed explanation for the dashboard’s development, please refer to this article in The Lancet by Professor Lauren Gardner.
Johns Hopkins Center for Systems Science and Engineering.
The map is maintained in near real time throughout the day through a combination of manual and automated updating. The time of the latest update is noted on the bottom of the dashboard. The GitHub database updates daily at around 11:59 p.m. UTC. Occasional maintenance can result in slower updates.
 Researchers identify antibodies that may make coronavirus vaccines unnecessary
 People who practice intermittent fasting experience less severe complications from COVID-19
 U.S. FDA issues risk of heart inflammation after Novavax COVID vaccine
 Chemical found in leafy greens shown to slow growth of COVID-19 and common cold viruses